Traditional definitions of country of origin have become blurred. Some iconic ‘local’ brands are actually manufactured abroad, while some foreign brands have built a manufacturing presence here. And some global brands have been in the market for so long consumers perceive them to be local. Whichever way, brand origin can be a valuable asset for both global and local companies.
When it comes to choosing a product, do consumers prefer global brands or local ones? Around half of New Zealanders (52%) try to buy NZ-made products as often as possible but it really depends on the category.
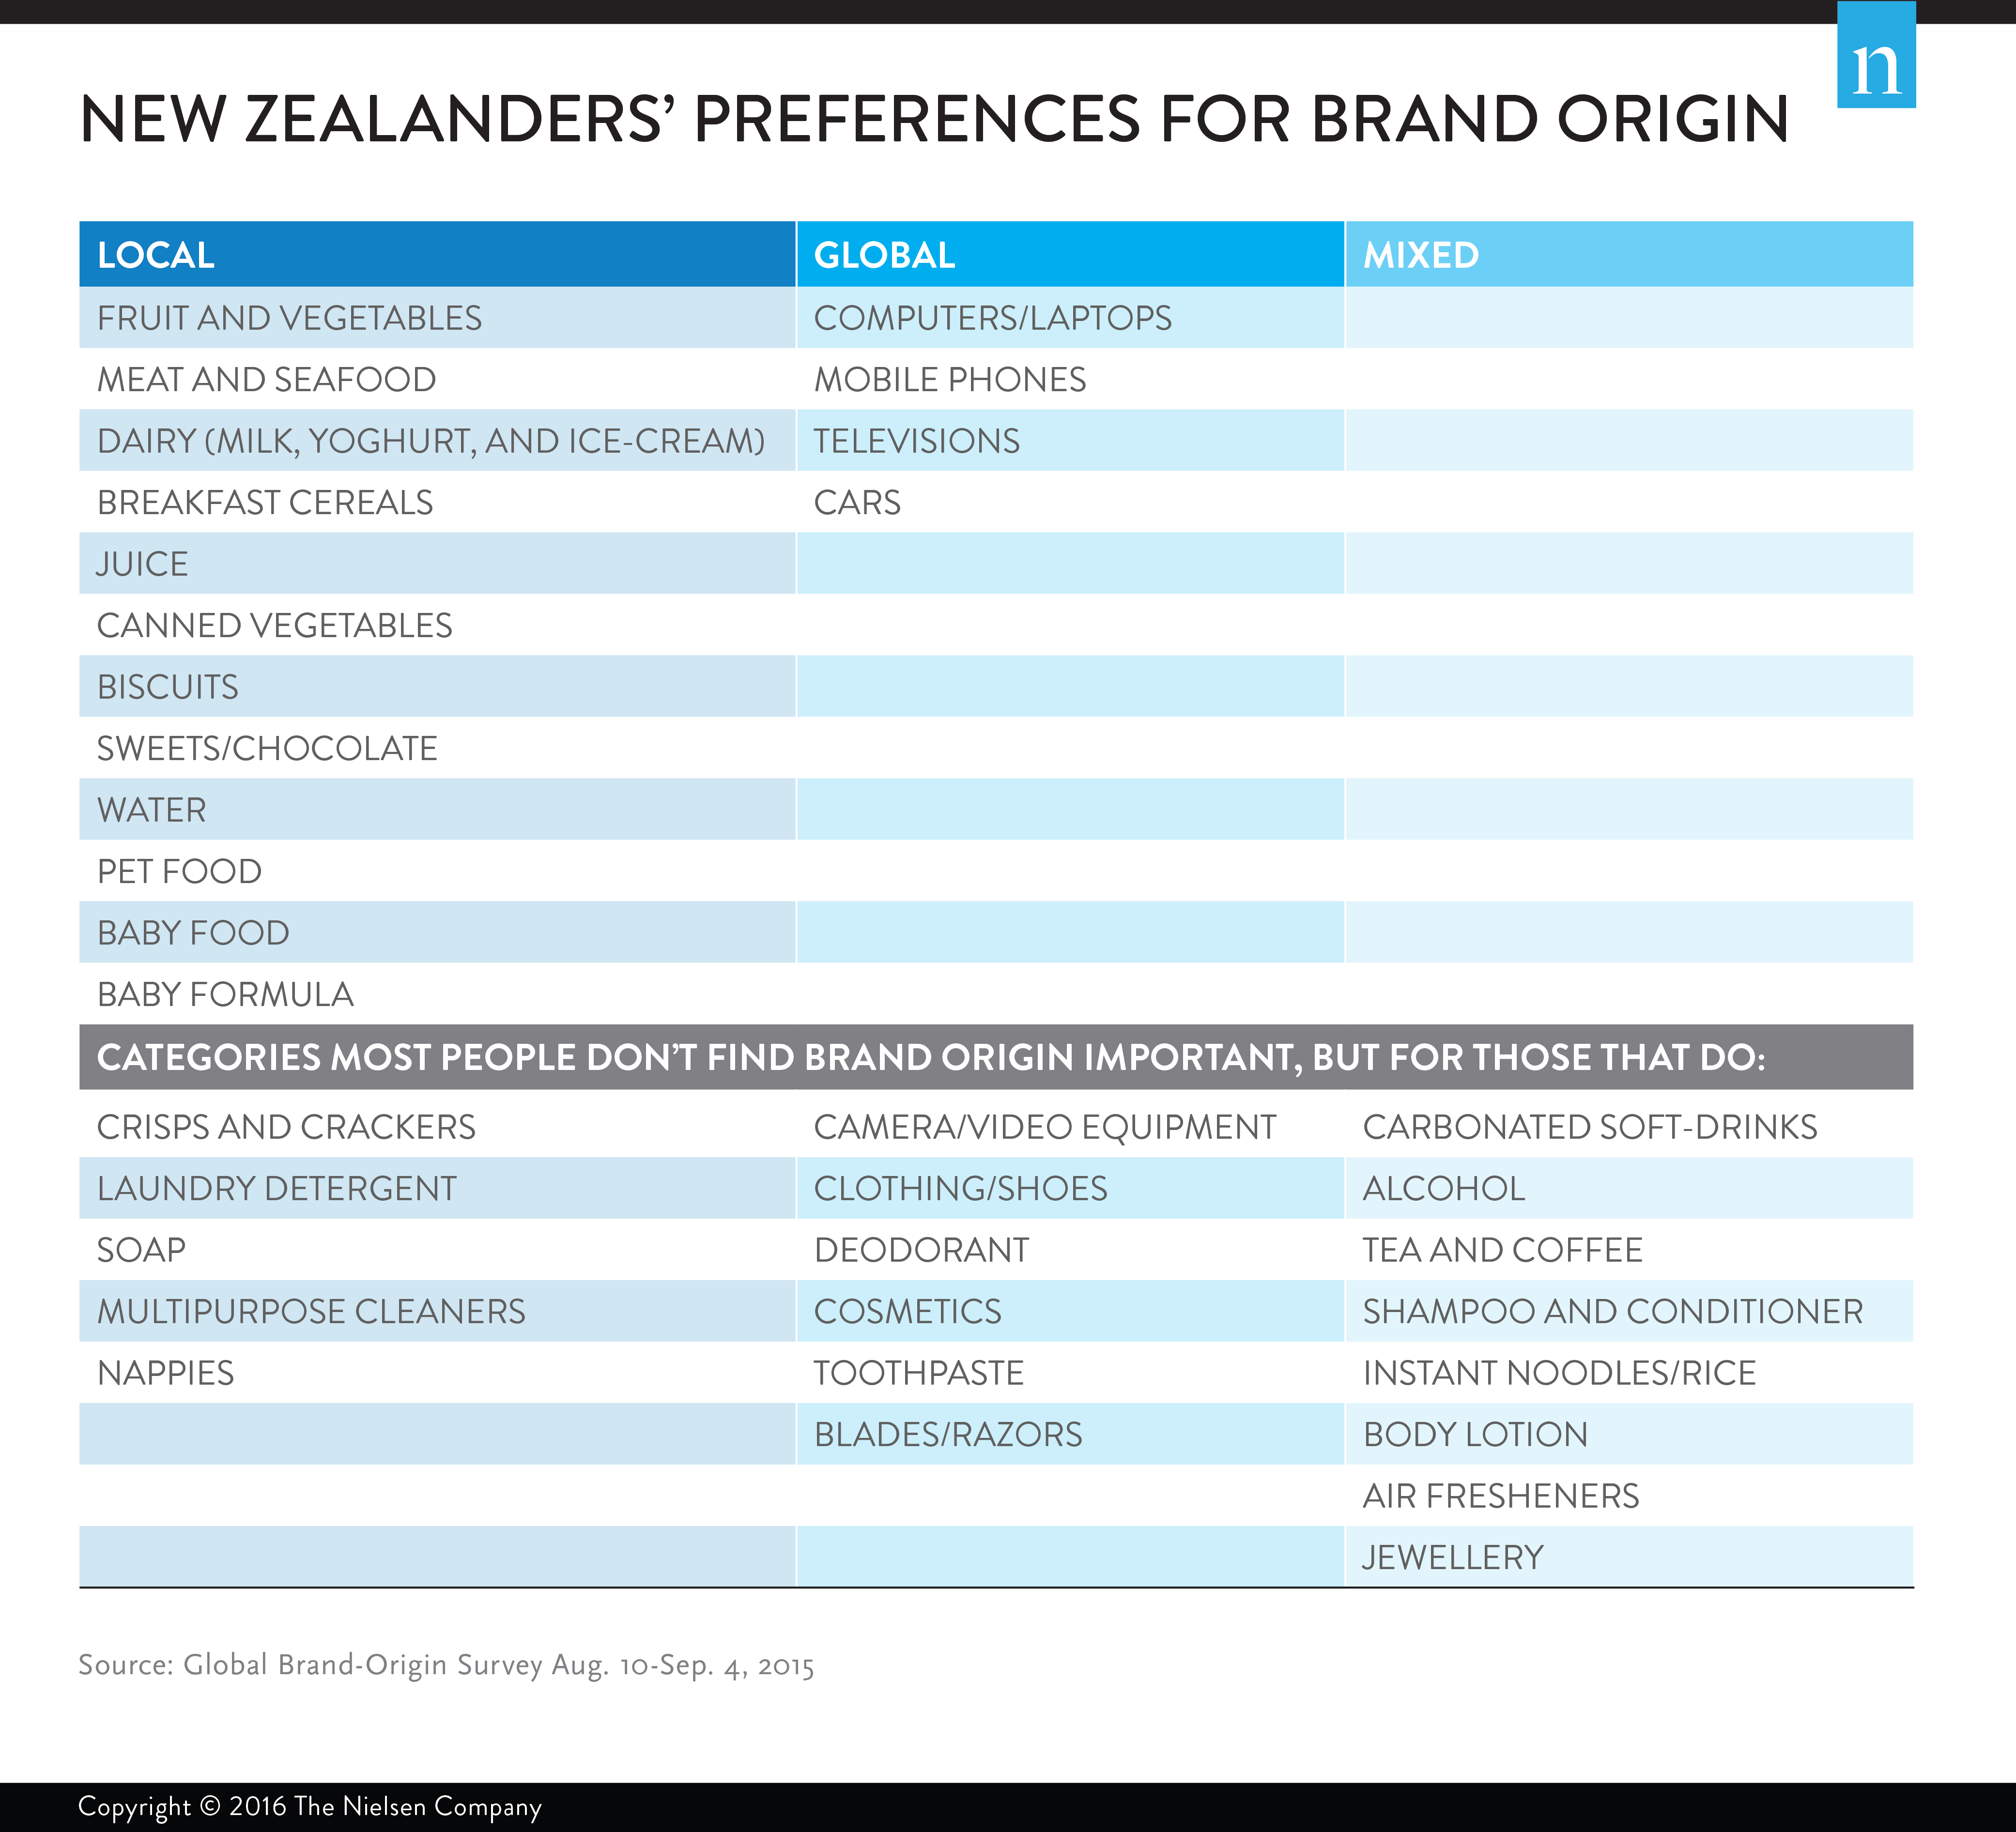
Understandably, for fresh foods, local is the clear preference. They are able to provide farm-to-table freshness. Buying local vegetables rather than global produce is preferred by seven-in-ten New Zealanders (71% vs. 5%), a similar number of people prefer local meat (70% vs. 4%), fruit (69% vs. 5%) and milk (69% vs. 6%). These are followed by seafood (59% vs. 5%) and yoghurt (53% vs. 9%) for local preference when shoppers consider a purchase.
It’s all about local for fresh. Increasingly consumers are more interested in the provenance of their food and New Zealand suppliers are perfectly placed to deliver to this need.
For packaged foods and snacks local taste preferences dominate. Among New Zealand respondents who purchase the category, local brands are preferred to global brands for ice-cream (51% vs. 9%), breakfast cereals (46% vs. 12%), canned vegetables (41% vs. 11%), biscuits (39% vs. 12%), confectionary/chocolate (37% vs. 17%), and crisps and crackers (35% vs. 12%).
Succeeding in the packaged food and snack categories is all about understanding consumer tastes in the local market. Local brands often cater best to local preferences due to their agility and ability to innovate. This contrasts to global brands that capitalise on economies of scale and offer more homogenous products across markets.
The Collective dairy is a great success story. In the last couple of years they have grown their sales by three-quarters. They use local flavors such as pear and feijoa and in addition, they specify the provenance of their milk, sourcing from ‘farms as far south as Waikato and as far north as Northland.’
Preferences are mixed for beverages. New Zealand respondents prefer local brands for juice (45% vs. 8%) and water (35% vs. 4%). Opinions are split, however, when it comes to alcoholic beverages (17% vs. 21%), carbonated soft drinks (20% vs. 21%), and coffee and tea (26% vs. 26%) but the largest percentage of people say brand origin is not important to them (37%, 36% and 39% respectively).
With high product development costs for durables and electronic goods and the need for economies of scale, it’s not a surprise that there’s a clear preference for global brands such as computers (48%), mobile phones (46%) and cars (39%).
For personal and home grooming, the largest percentage of respondents in New Zealand say brand origin isn’t important. But for those who do think it is important, they narrowly prefer local for laundry detergent (28% vs. 17%), toothpastes (27% vs. 23%), and soap (26% vs. 19%) and global for deodorant (26% vs. 17%) and cosmetics (25% vs. 12%).
There are only a few New Zealand brands that manufacture in the personal and home grooming categories. It’s interesting that local brands that do supply these products tend to have an Eco focus, playing to our clean green NZ credentials.
When it comes to baby care, local brands are preferred in New Zealand for baby food (62% vs. 16%) and baby formula (57% vs. 13%). This contrasts to most other regions where global products are preferred. As a milk producing and exporting nation, it’s likely our local brands have high quality and safety regulations, and to consumers this is paramount when providing for infants.
When asked the top factors for choosing either global or local we see that New Zealanders place most importance on price, previous good experience, promotions, and better product benefits such as flavor for deciding on a brand.
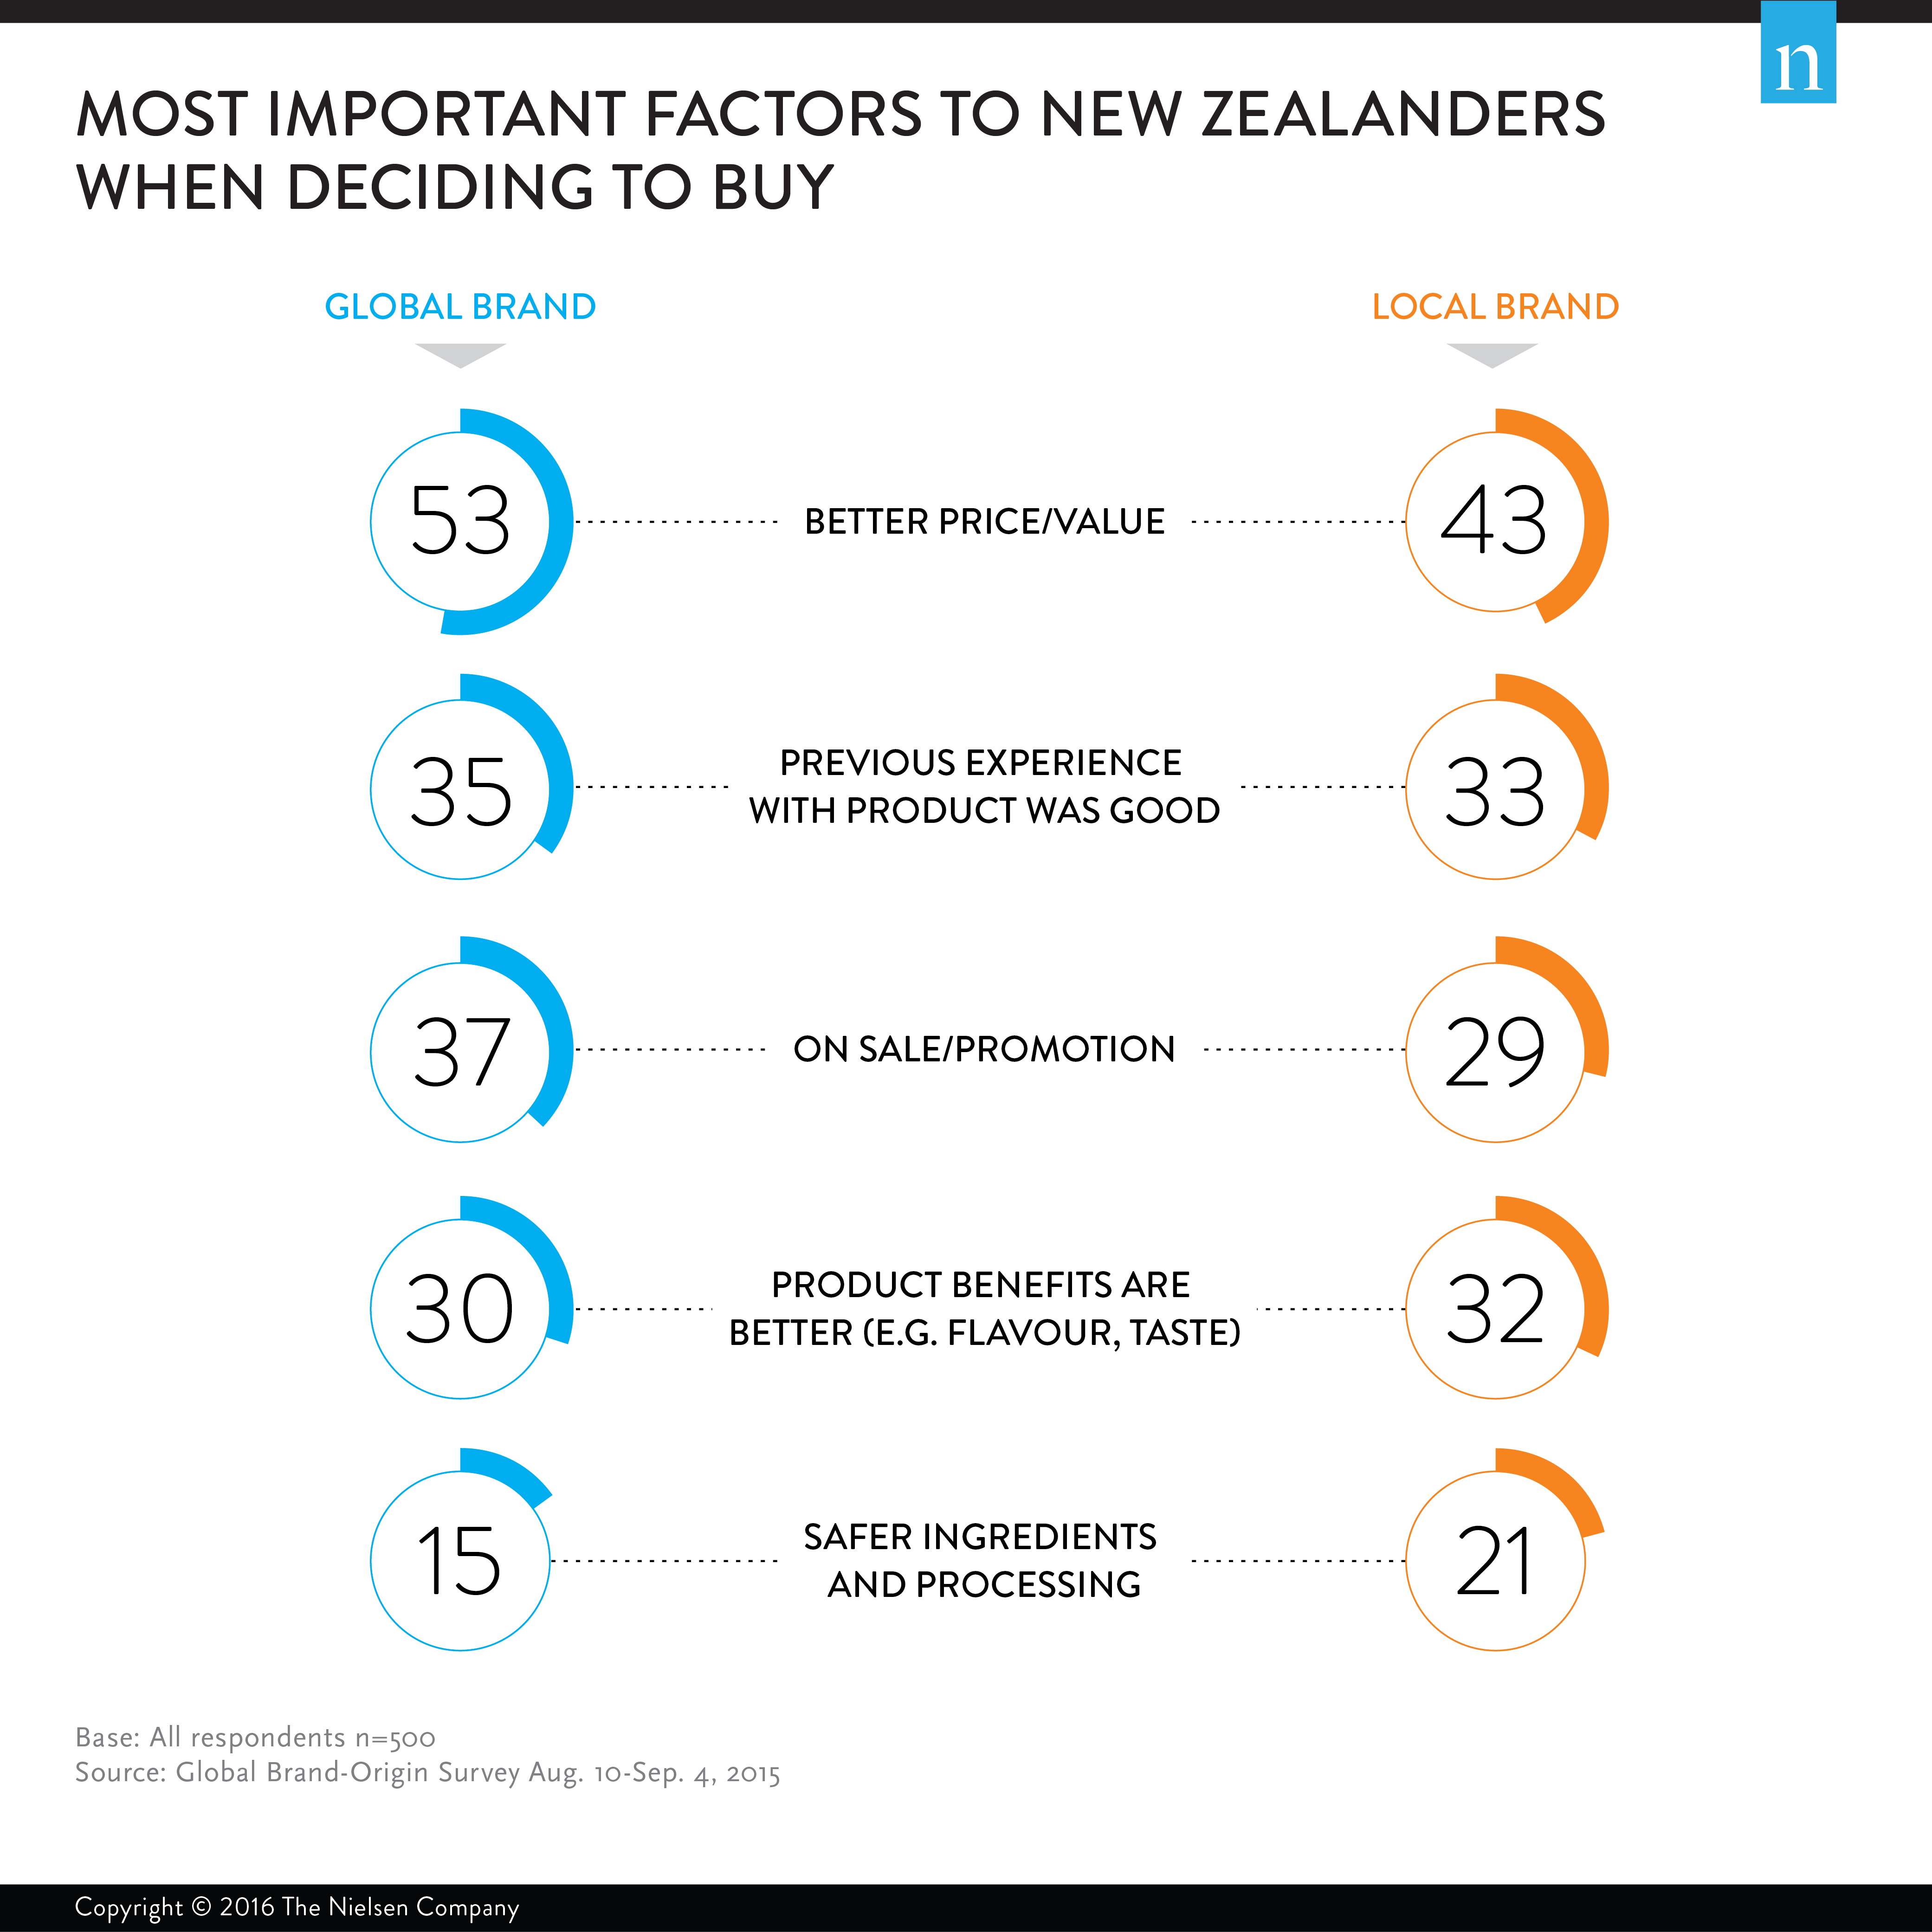
Only 14% of New Zealanders say national pride is one of the most important reasons for choosing local brands but nearly three-fifths (59%) strongly or somewhat agree they prefer buying local brands because they support local businesses.
So what can local and global companies learn from each other?
Be global, act local
Multi-Nationals should look for opportunities to localize global products, leveraging their global brand but customizing products for local preferences. Global companies need to respond quickly to changing consumer behavior, but waiting for approval from company headquarters decreases their flexibility and agility. They should lean more on local teams for decision making, product development authority, and advertising.
Invest in talent
Local companies may not have the same depth in their talent pool as global brands, but attracting skilled talent must be a priority. The expertise of key leadership roles requires significant investment in training to develop knowledge and skills. It also involves offering financial incentives on a par with the market, and opportunities for career development to keep employees satisfied.
Innovate, innovate, innovate
While local companies might not have their global counterparts’ vast resources for new product development, they have a deep understanding of the needs of their consumers, and they often have a flagship brand built on relevance to the local shopper. Additionally, they maintain local decision making authority, so the time from concept to creation can be shorter. Local brands should use these advantages to innovate in areas of unmet and emerging needs and get products to market ahead of competition.
About the NielsenIQ Global Brand-Origin Survey
The NielsenIQ Global Brand-Origin Survey was conducted Aug. 10-Sep. 4, 2015, and polled more than 30,000 online consumers in 61 countries throughout Asia-Pacific, Europe, Latin America, the Middle East/Africa, and North America. The sample includes Internet users who agreed to participate in this survey and has quotas based on age and sex for each country. It is weighted to be representative of Internet consumers by country. Because the sample is based on those who agreed to participate, no estimates of theoretical sampling error can be calculated. However, a probability sample of equivalent size would have a margin of error of ±0.6% at the global level. This NielsenIQ survey is based only on the behavior of respondents with online access. Internet penetration rates vary by country. NielsenIQ uses a minimum reporting standard of 60% Internet penetration or an online population of 10 million for survey inclusion.