Metros lead the growth wave while rural decelerates
In Q3 2021, urban markets led by Kolkata, Hyderabad, Mumbai, and Pune spurred FMCG growth. Food products like cooking mediums (edible oil) and impulse foods like salty snacks contributed to this growth, while within non-foods, personal care and fabric care fed the uptick.
In comparison, a slowdown has been seen in rural areas (9.4% value growth in Q3 2021 vs. 10.6% Q3 in 2020) due to a 2.9% decline in consumption amidst the rising prices of goods. Consumers lessened their consumption of cooking medium, packaged grocery, and hot beverages; while for non-food, they reduced their use of fabric care and personal care products.
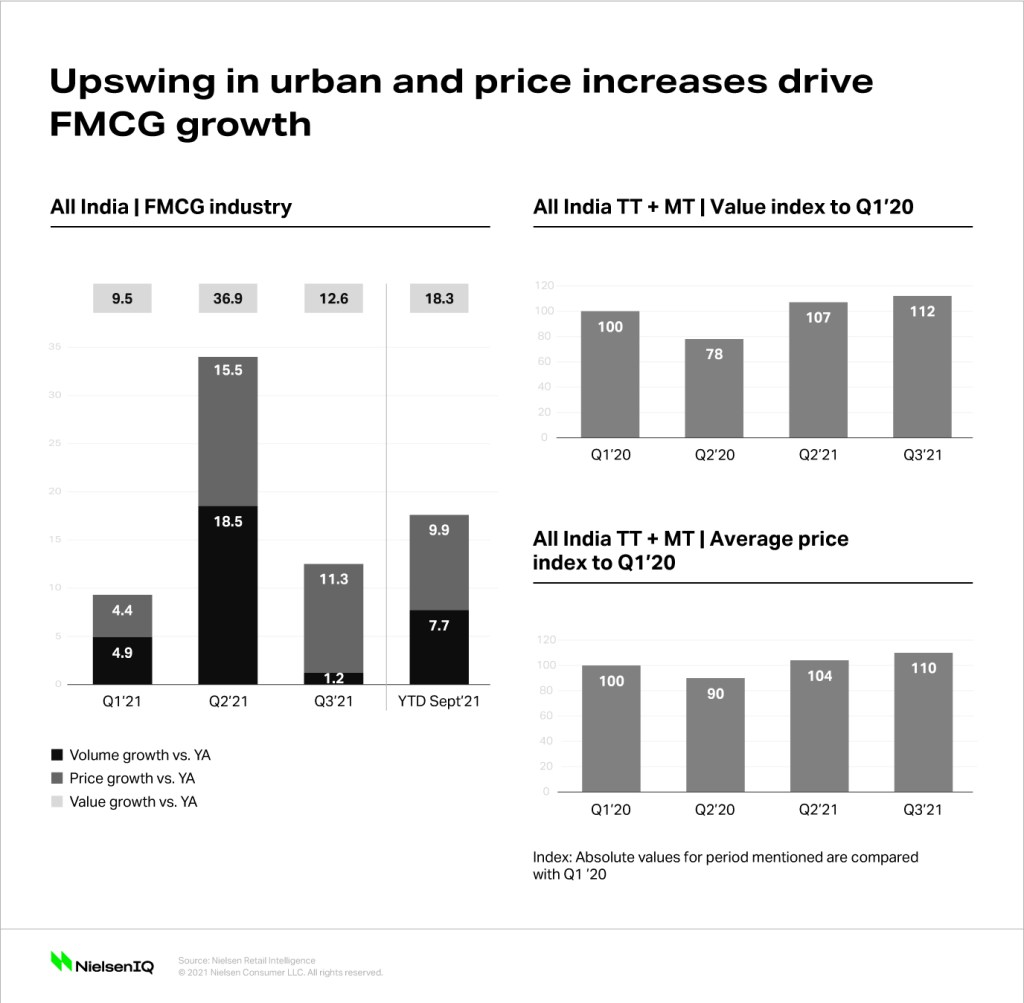
Escalating prices propelled FMCG growth
Overall, NielsenIQ recorded a significant price-led growth in the Indian FMCG industry, attributing it to price hikes on commodities, raw materials, and fuel and transportation costs. While price increases have resulted in a double nominal growth, there was a drop in volume growth for the industry.
Average price—which was indexed at 110 during Q3 (vs. Q1 2020 base 100) for overall FMCG and 115 for food baskets—largely propelled this growth. This price growth was seen especially in staple categories like cooking medium , habit-forming foods like tea, and impulse foods like salty snacks and sweets. Volume growth is driven by packaged rice, breakfast cereals, butter/margarine, and chocolates.
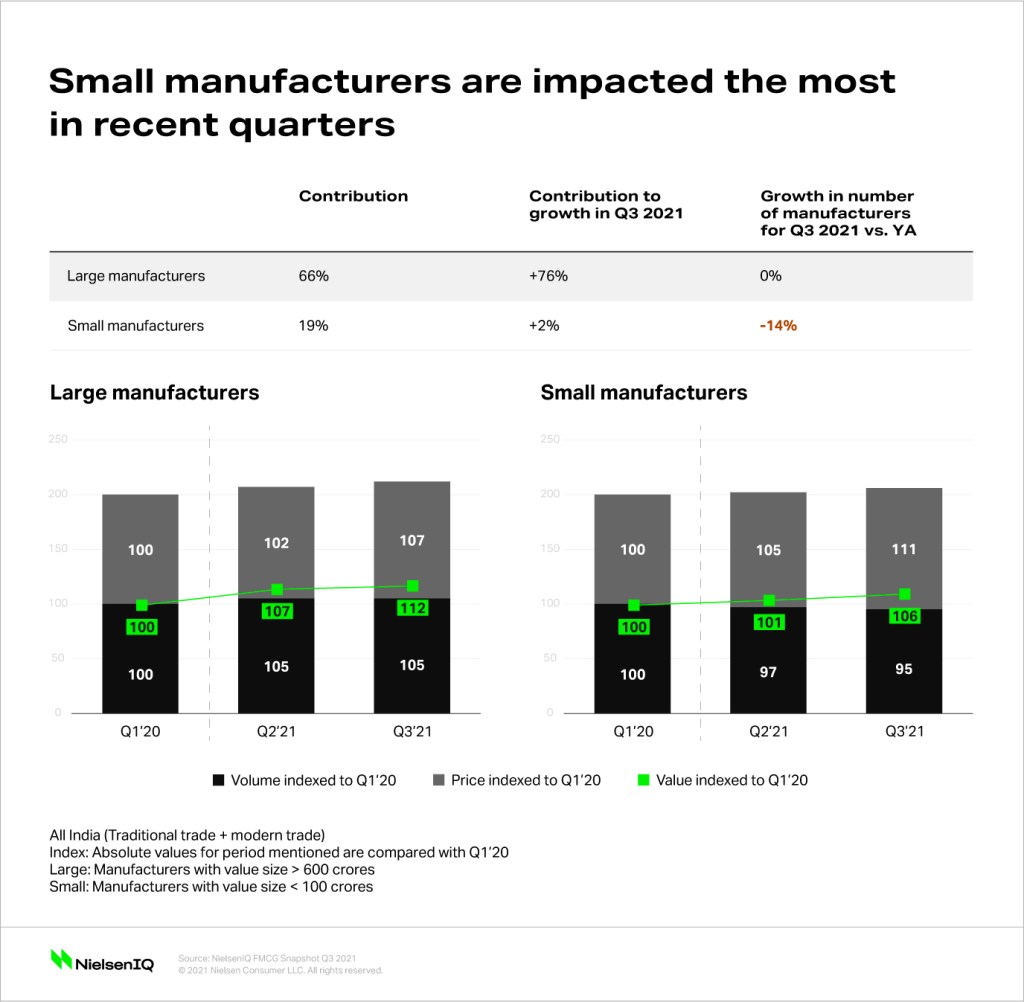
Pricing impact on manufacturers
Popular price segments that have a relative price index of above Rs 80 across the FMCG industry saw an uptick in contribution, with a 59% share in Q3 2021 (versus 56% in Q1 2020). On the other hand, mass price segments that have a relative price index of below Rs 80 dropped to 17% in Q3 2021 from 19% in Q1 2020.
Input cost pressures have forced manufacturers to raise prices—especially for food products and cooking mediums. This has severely impacted small manufacturers, as 14% have exited the business in Q3 2021 compared to Q3 2020. Out of the total value growth that the industry had in September 2021 (compared to a year ago), 76% of this growth came from large manufacturers, while the small players had just 2% with the rest coming from mid-size players.
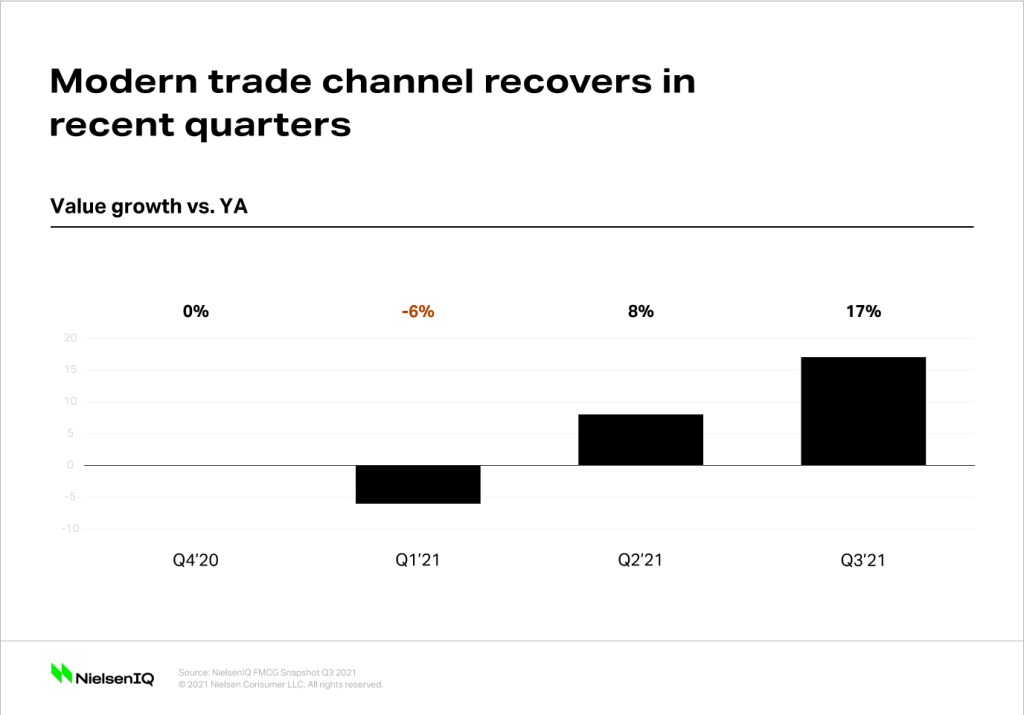
Organized channels on a path to recovery
The relaxation of mobility restrictions has paved the way for the recovery of brick-and-mortar stores. Modern trade stores have grown 17% in Q3 2021, doubling their growth from Q2 2021. Busy shopping days in August with Raksha Bandhan and the Indian Independence Day jumped 29% when compared to the same period last year—with the growth driven primarily by banner or modern trade chain stores. Within modern trade, food baskets led the growth over non-foods.
The e-commerce channel owes its steady expansion in Q3 to the high growth of food categories after the first wave of COVID-19 in the country. The personal care category also continued to push the channel’s growth consistently this year.

Get the full picture of India’s FMCG industry
To help you plan your winning moves, you need complete and unparalleled RMS data. Book a meeting with us to know more.