
BASES OmniShopper Fundamentals
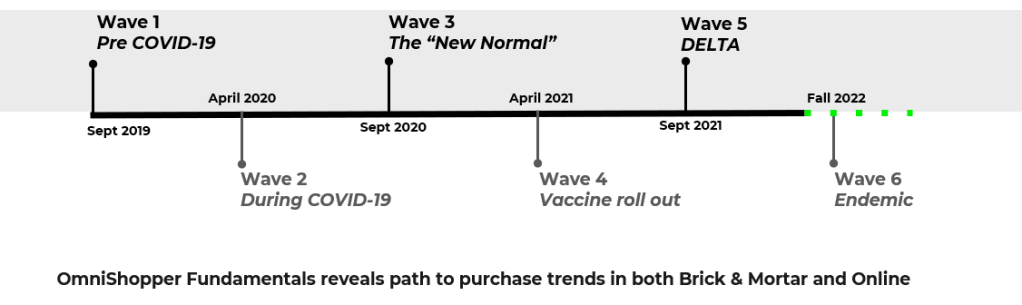
Multi-wave insights to understand changes in behaviors
What if you could answer the following questions with ease and accuracy?
- How is the current path to purchase different from pre-COVID19 or lockdown?
- What is the pandemic’s impact on impulse vs. planned purchases?
- Which categories drive traffic in an omnichannel context?
- How can you influence decisions at the shelf and online?
- How does fulfillment method influence what shoppers want?
36%
of food purchase transactions surveyed in September 2022 included a click. Only 66% were only-offline transactions.1
67%
of non-food purchases surveyed in September 2022 were purchased with a specific brand in mind.
What is it?

Survey based dataset to understand a Category specific Path to Purchase
Covers category purchases across eComm and B&M fulfillment types
Delivered via an interactive platform (Power BI) that is trendable and allows for a wide array of filters (geo, demo, fulfillment, journey)
Why BASES?
Online and offline trendability
Shows how both brick & mortar and online category purchasing evolves through critical points in time, with a pre-COVID comparison point
Breadth and depth of categories
Data covers 132 food and non-food categories and includes coverage of top U.S. brick & mortar & e-Commerce merchants
Complete path to purchase insights
A complete view of the shopper’s path to purchase from before, during, and after the trip so that you can influence the shopper at every step
How is it used?

Shopper marketing
Allocate resources by category, fulfillment, channel, and trip type

Category management
Enhance category strategies with Voice of the Shopper proof points

Brand & experience marketing
Understand the relative importance of product attributes & shopping touchpoints across categories
What do I get?
01
Immediate understanding of the changing shopper behavior
Give your teams immediate access to the results of the online surveys fielded in the nationally representative NielsenIQ Homescan Panel
02
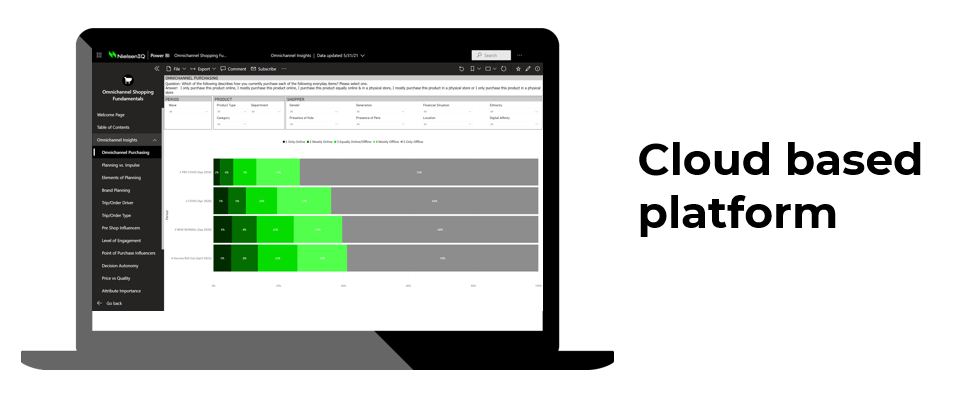
Delivered through an adaptable and accessible interface
The Power BI tool provides an easy-to-use user experience with robust filtering, intuitive visualizations, and options for data export to suit power user needs.
03
Packages are available that fit the need of your business
- Packages start at $15,750 for one wave of data
- Data is refreshed annually
- Every subscription includes cloud-based access to the reporting tool in PowerBI and a high-level summary of annual trends
Want to learn more?
Our team is here to help you better understand the OmniShopper.
1Source: NielsenIQ Omnichannel Shopping Fundamentals online survey fielded in nationally representative Nielsen Homescan Panel during Sept 2021 Post Vaccine among 132 CPG categories.
Stay ahead by staying in the loop.
Don’t miss the latest insights, offerings, and opportunities from BASES
By clicking on sign up, you agree to our privacy statement and terms of use.